13-hour Data Visualization with D3.js
The Data Visualization with D3.js course was created by Curran Kelleher, organized and hosted on freeCodeCamp.org Youtube Channel. In the past two months, I followed the tutorial by Curran Kelleher and learned Data Visualization with D3.js as a beginner.
What I coded
I followed the tutorial and code each project and customised styles for some of the projects. Sources code are available on GitHub.
Here are the screenshot and demo of parts of the projects:
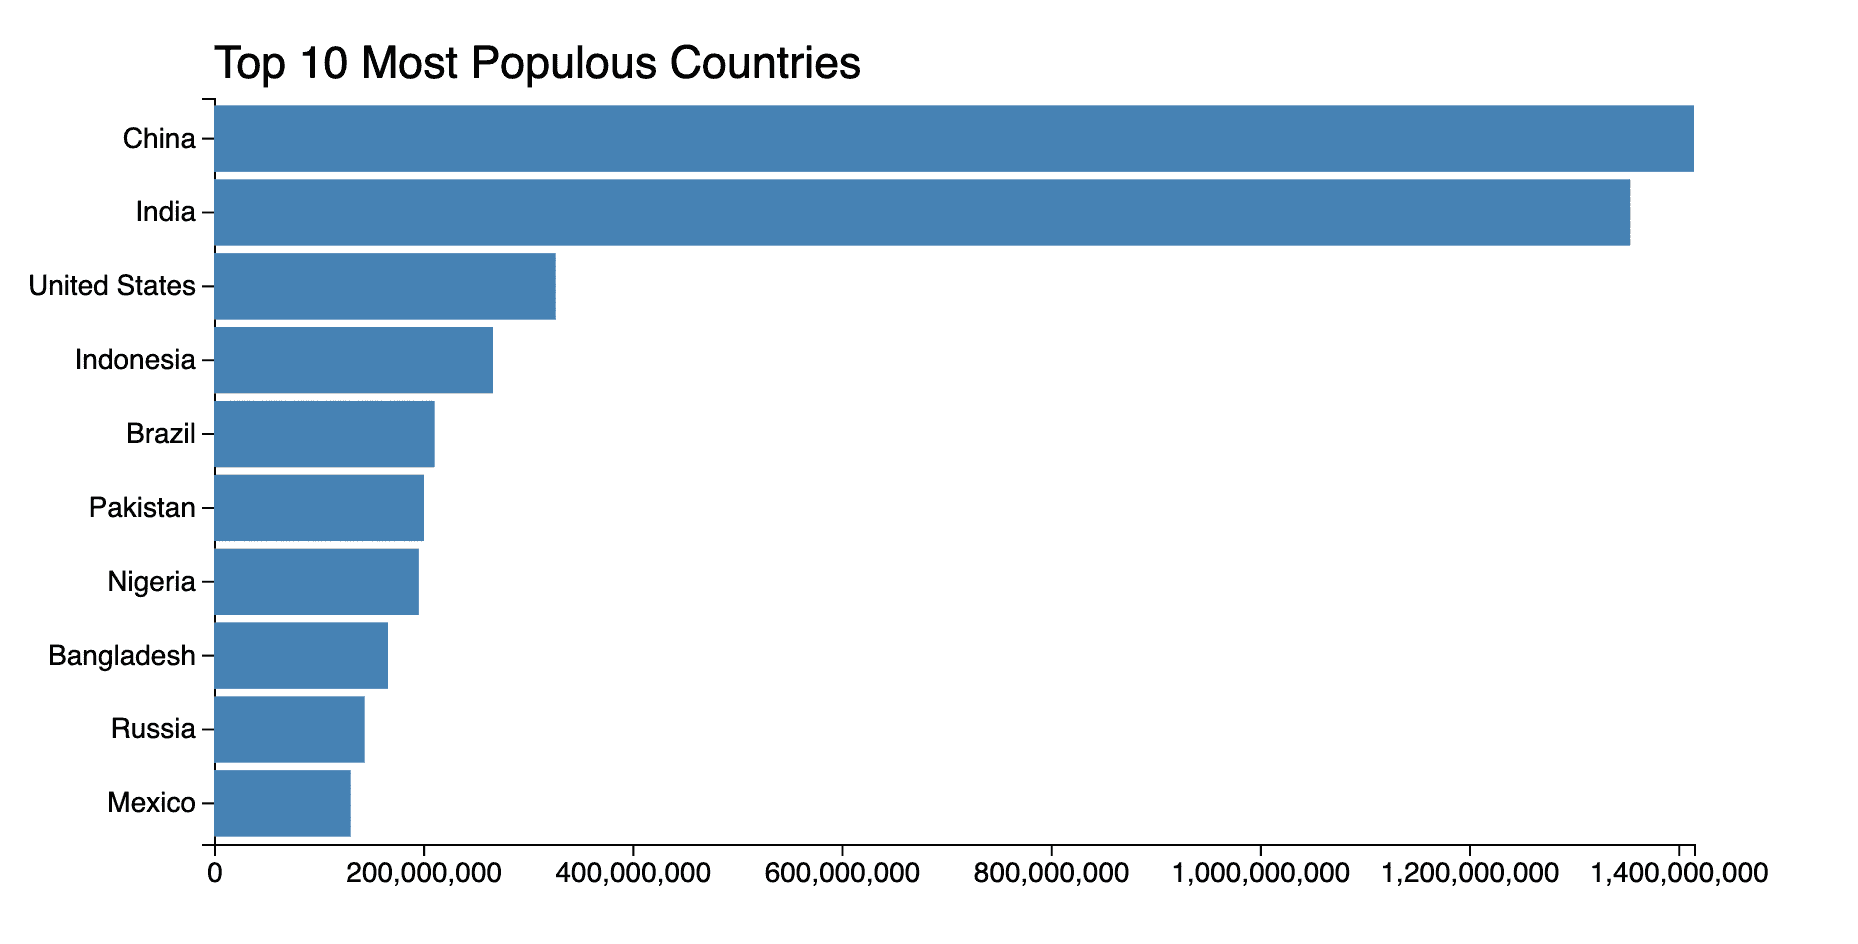
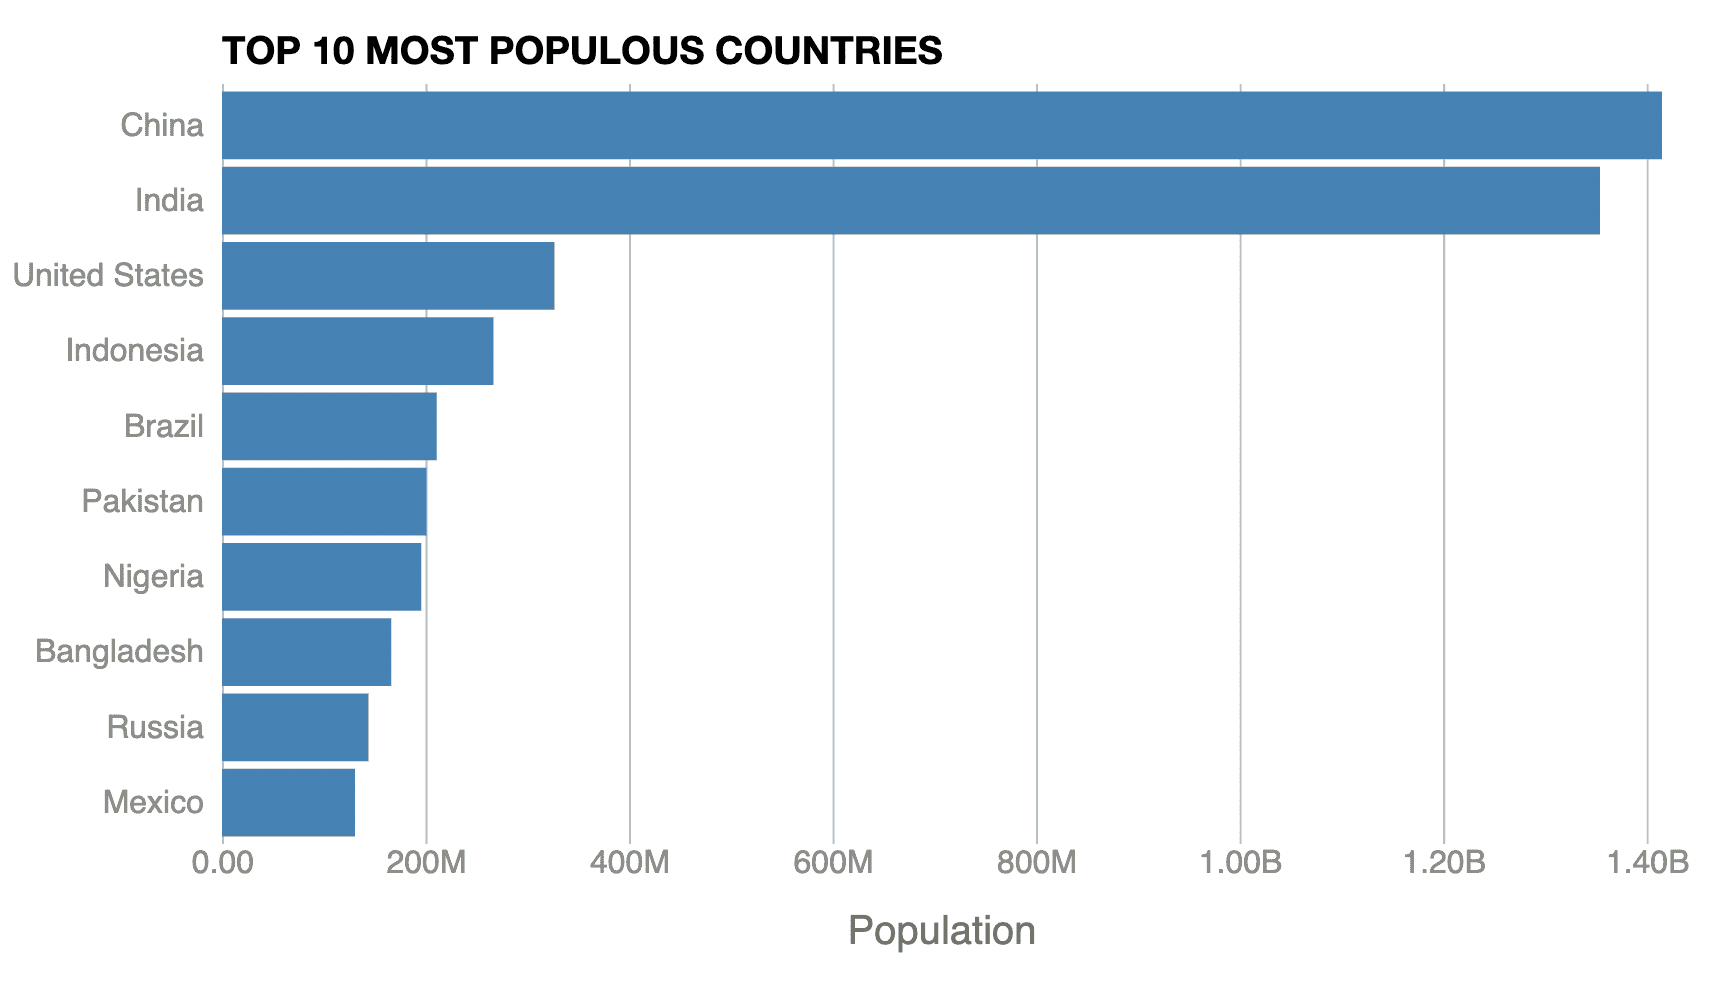
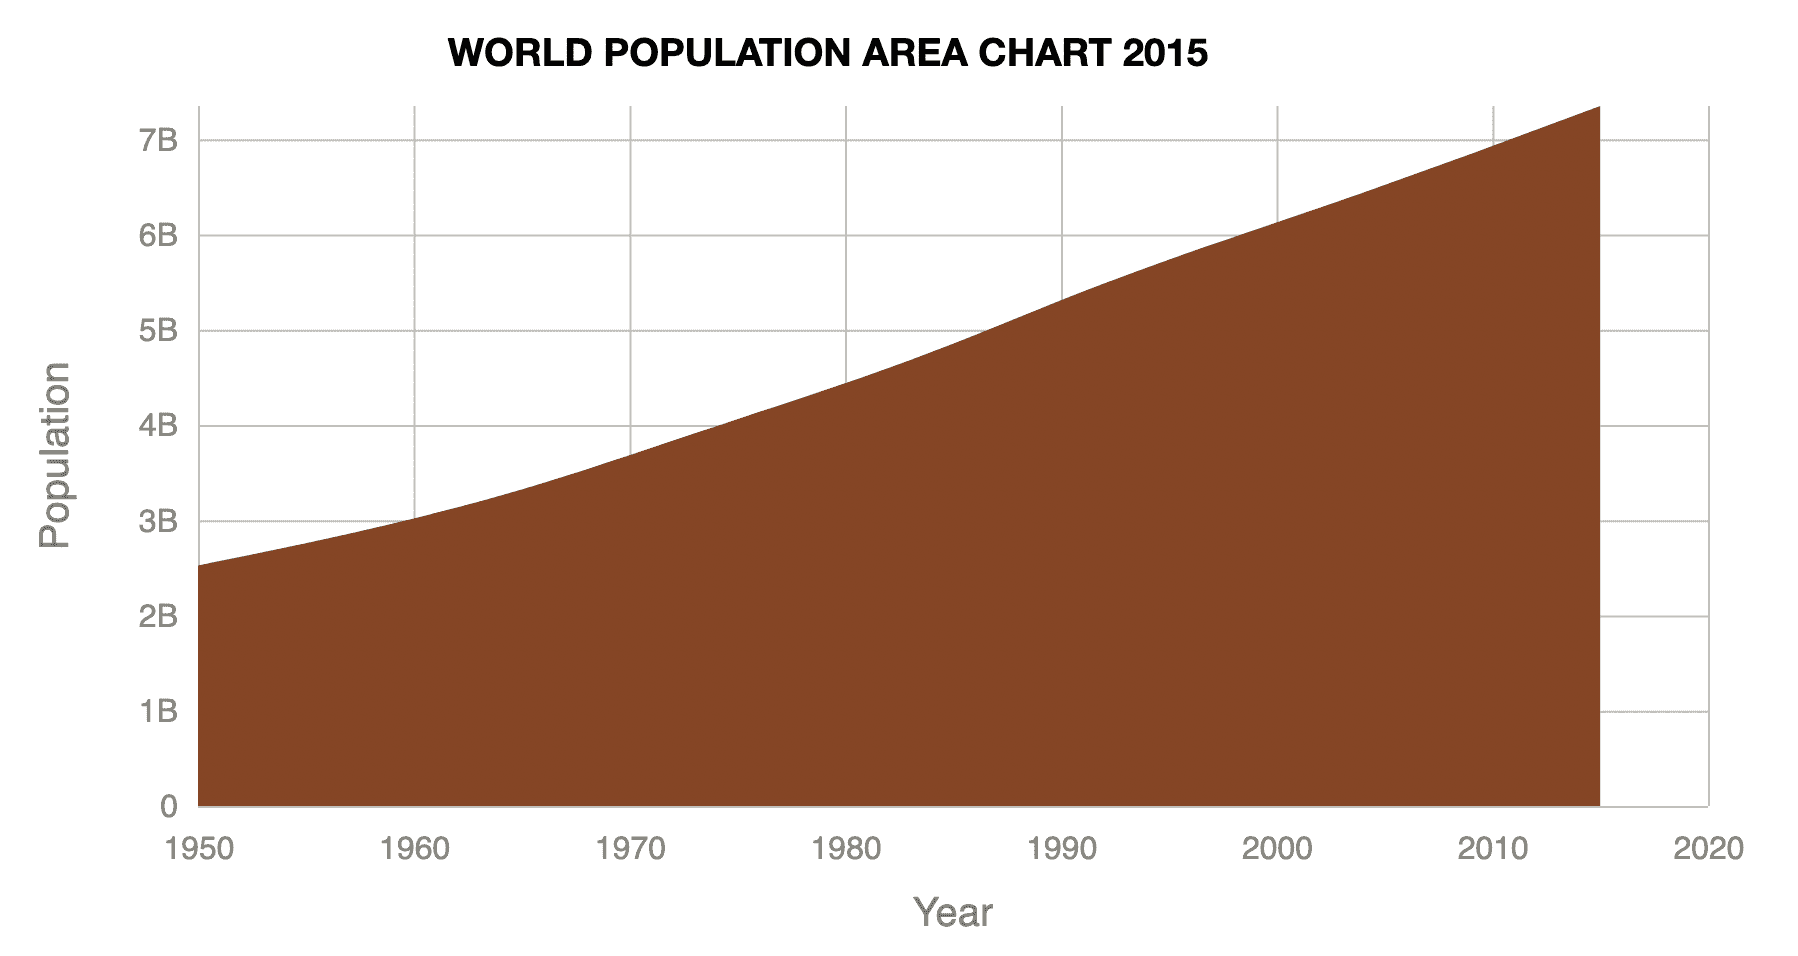
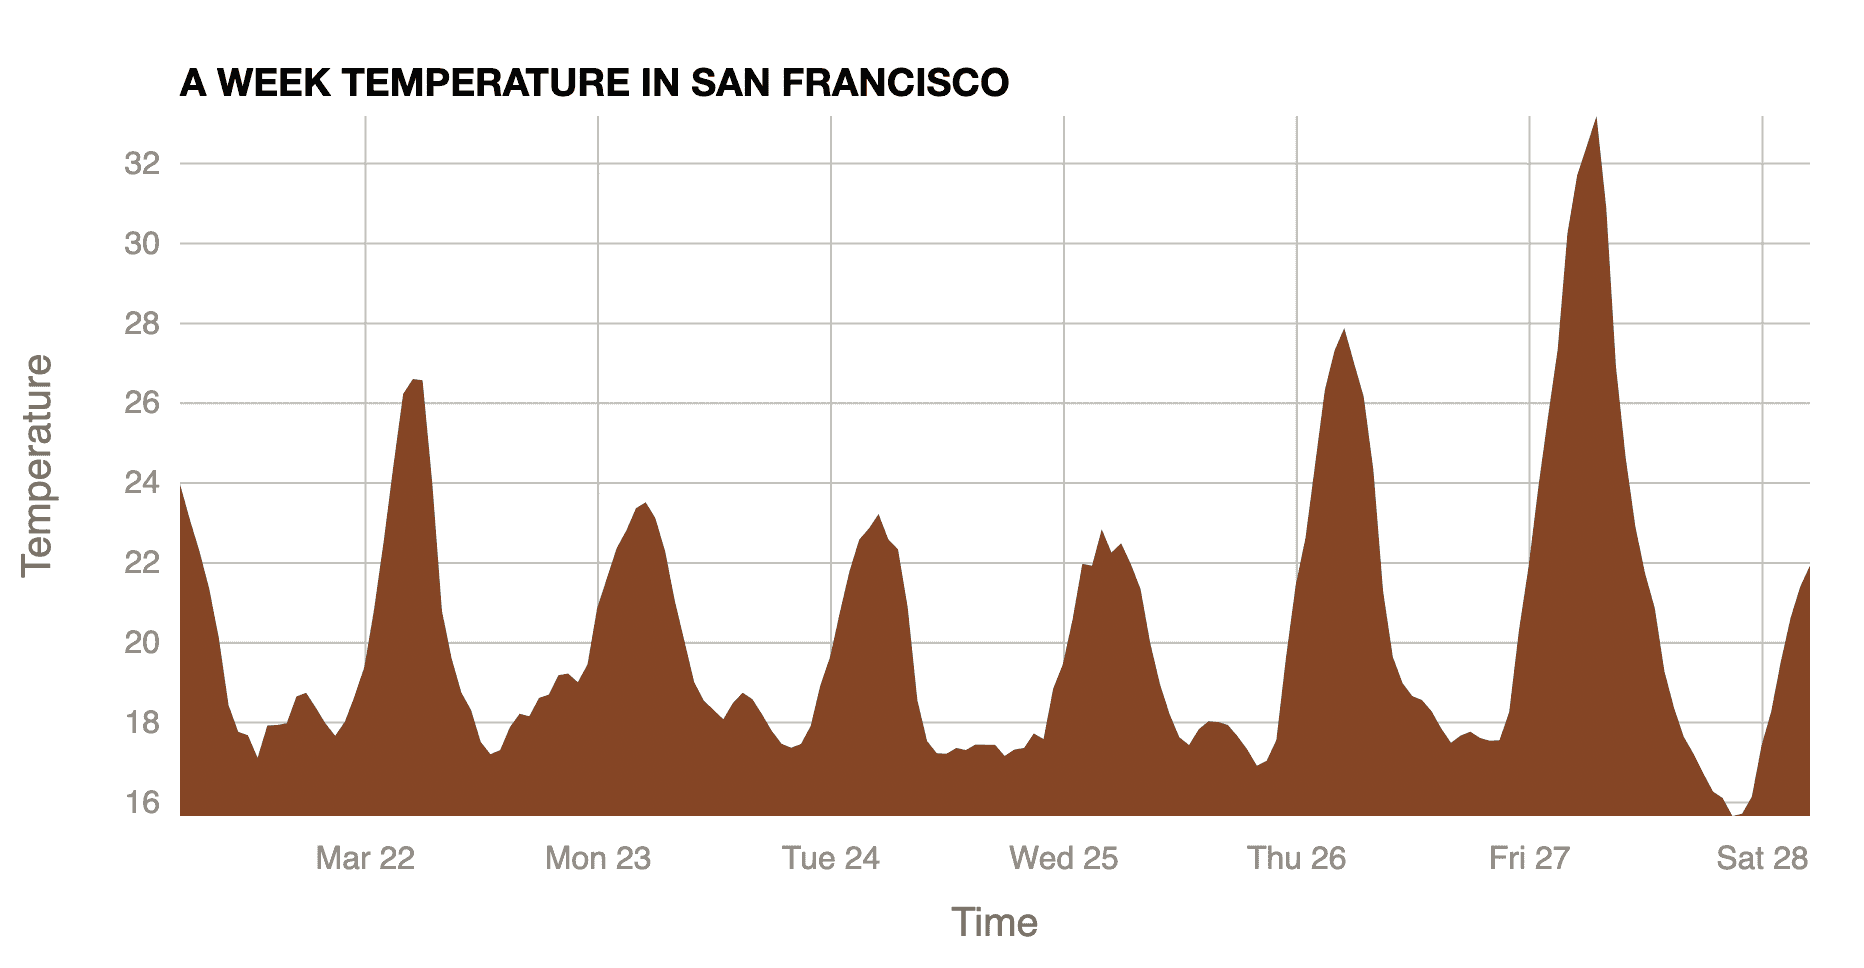
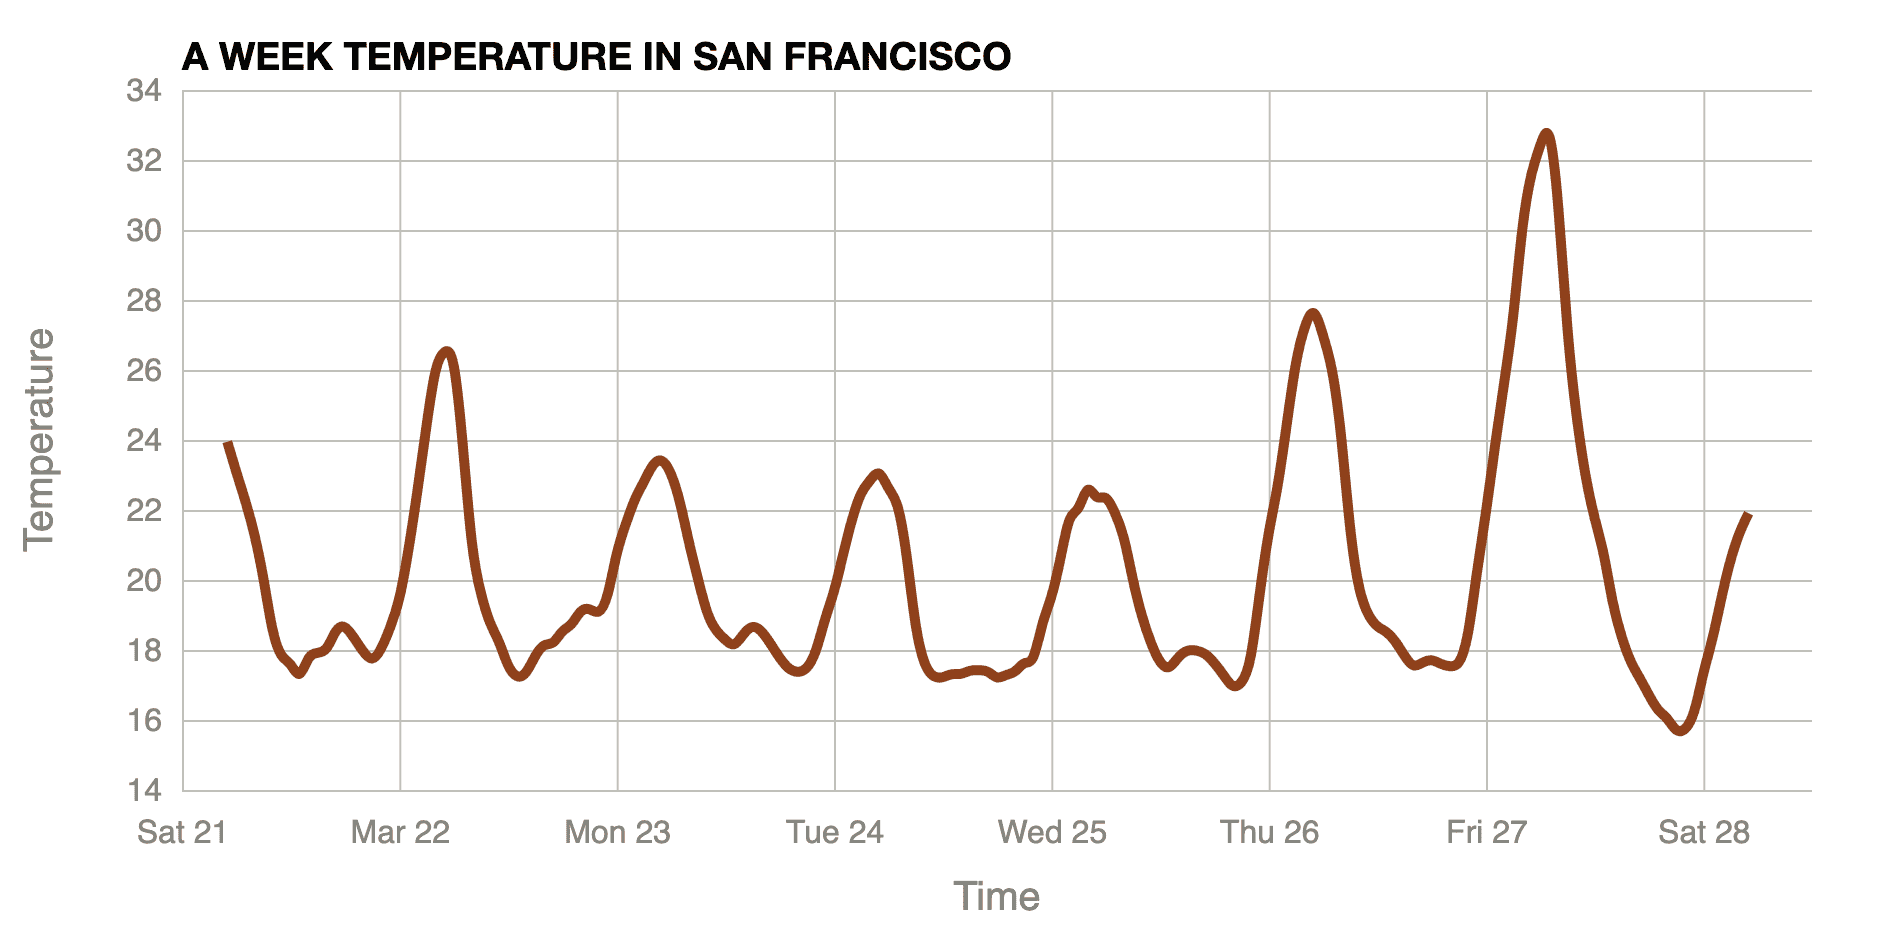
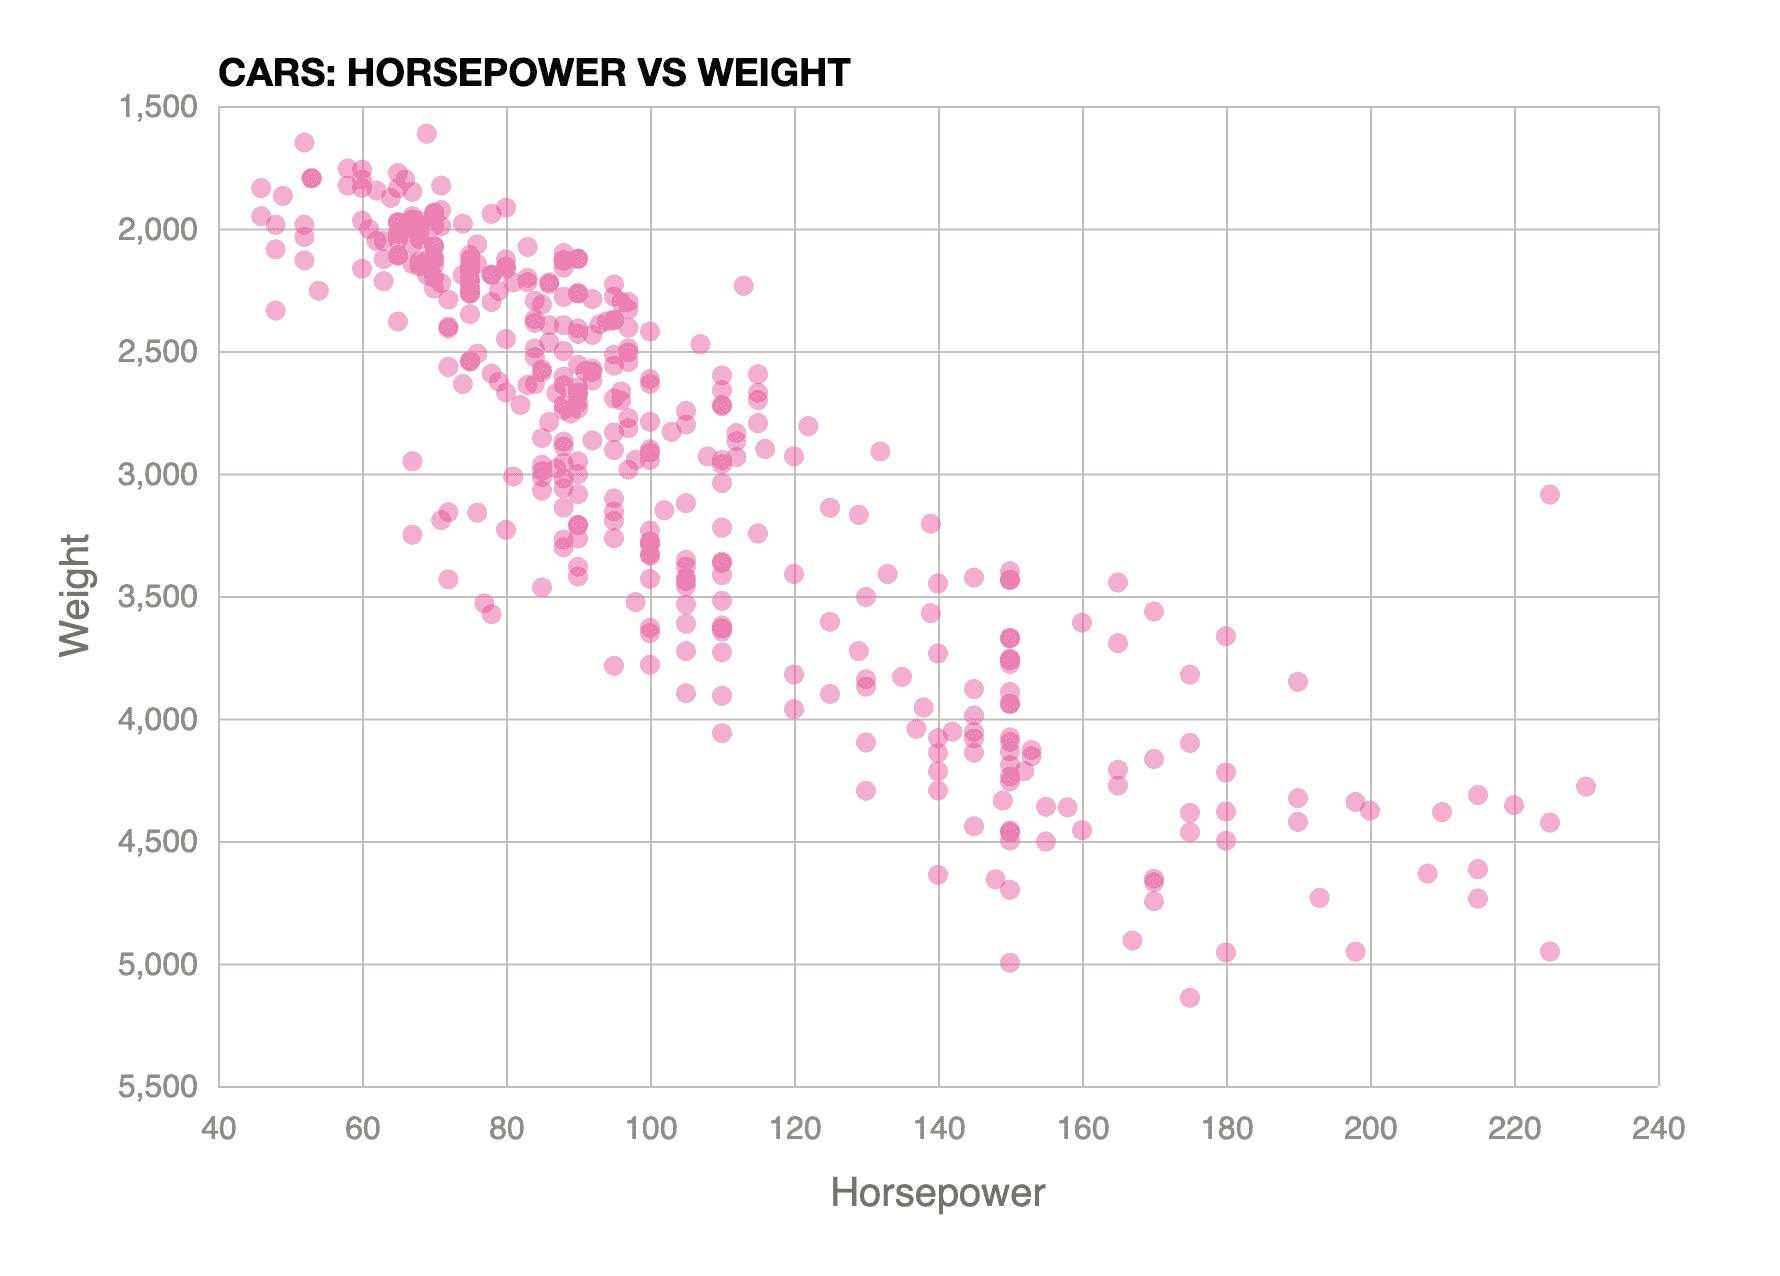
Basic Charts
General Update Pattern
Click Interaction
Making World Map

Choropleth Map

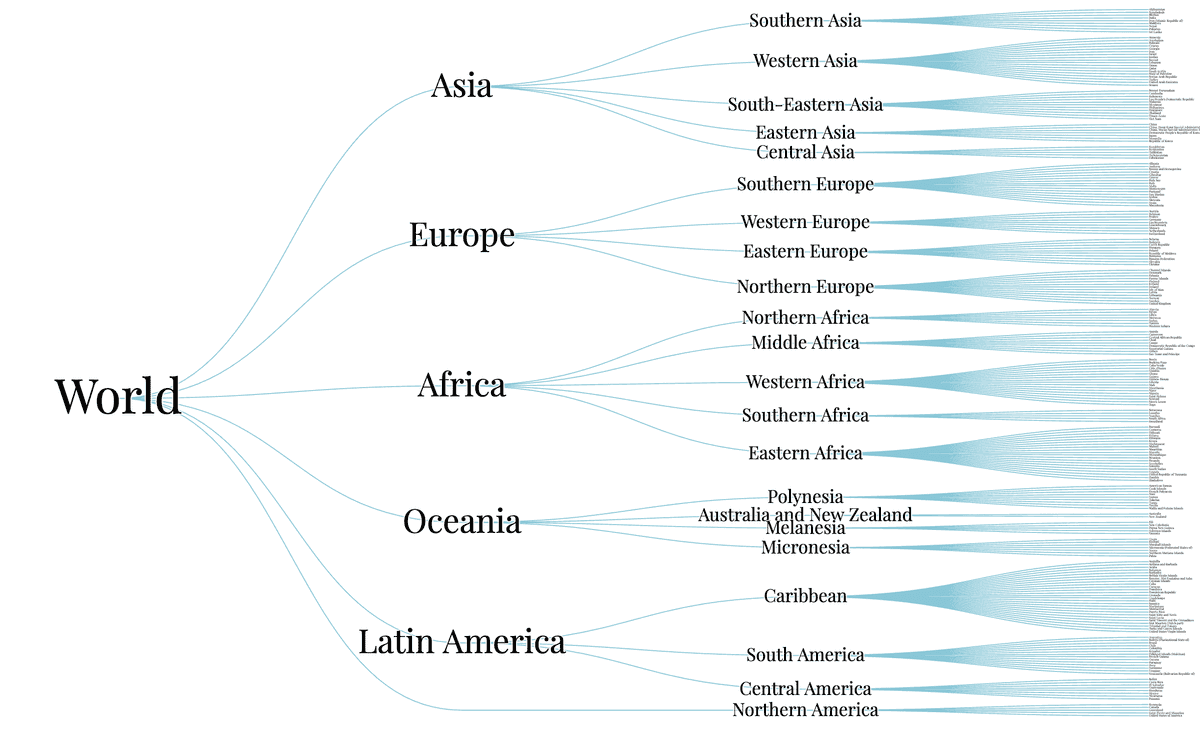
Tree Hierarchy
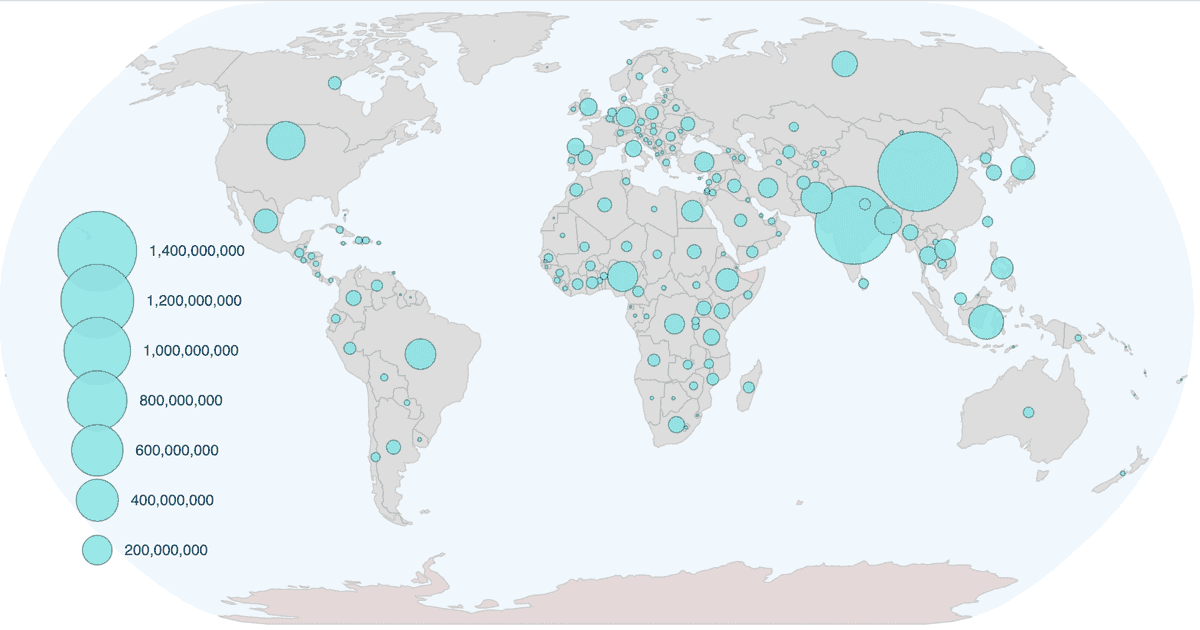
Making Circles on Map
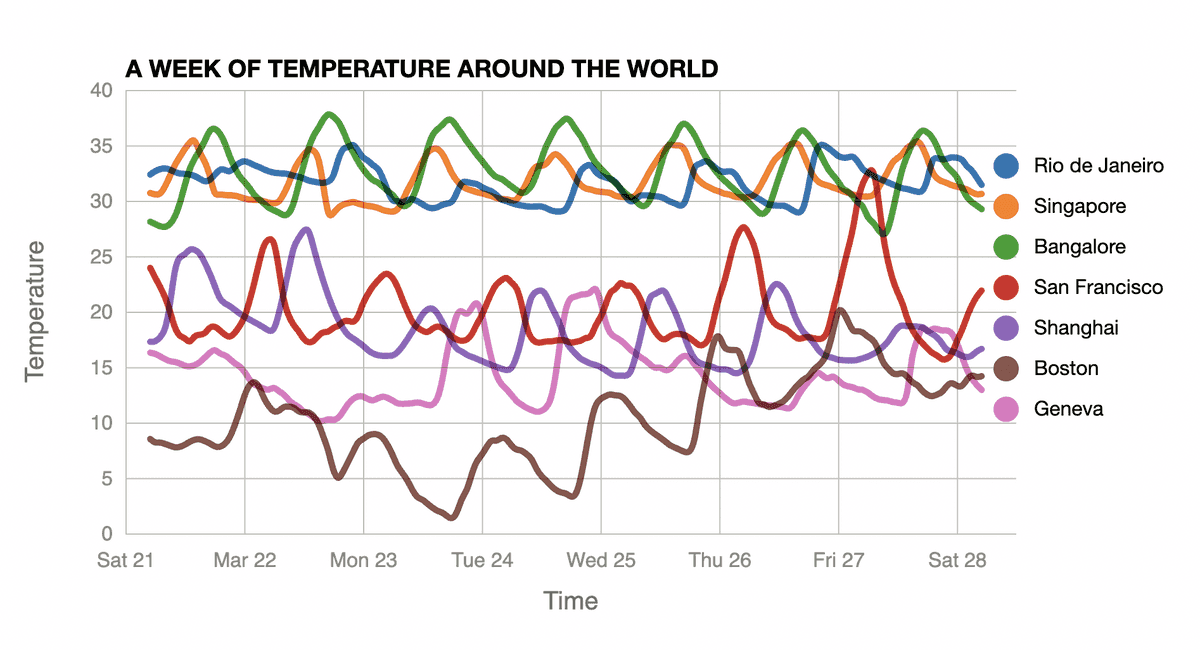
Line Charts with Multiple Lines
Select a Year on a Line Chart
Reference Resources
For the theory of Data Visualization, the course is following
- the book Visualization Analysis and Design by Tamara Munzner.
- and Tamara’s courseware: [Visualization Analysis & Design
Full-Day Tutorial](https://www.cs.ubc.ca/~tmm/talks/minicourse14/vad17fullday.pdf)
Why learn Data Visualization with D3.js
Instead of just watching the other’s Data Visualization work and sigh ‘Amazing’, I expect that one day I would be able to create the kind of data visualization work by my hands and make sure the work could delivery something useful for audiences.
D3.js is popular today and almost has become a basic framework to visualize data for the Web. I’ve read some simple tutorials on D3.js but hard to get the sense understanding the logic. Curran’s course on Youtube looks good and could be a good start for me.
How and what I learnt?
The course lasts about 13 hours. The tutor Curran encourages students to follow the tutorial and code on the VizHub platform he contributed.
I followed Curran’s recommendation coding myself just I set up my local environment with rollup.js for me to understand how a D3.js project can be set up and run as a standalone project.
How I feel of the journey?
- At the beginning, things are fun and interesting
- The first time I set up local development environment, it spent time to get rollup.js up and ‘watch’ code changing. Good luck finally I figure out the issue through StackOverflow.
- The course was created in 2017 while today some JavaScript grammar has evolved that would block the road. Good luck there are always hints online for me to find a way out for most of the cases.
- It is more than a journey of learning how to code in D3.js, but a training of how to keep calm and good mood to figure out problems.
- Curran is good at showing how he think and move forward to achieve goal. There are bullet points on each section which make the steps clear.
- Grammar of a language needs time to remember. The 13 hours practices helped me understood how D3.js works, what it can create and ways to figure out issues when code doesn’t work. If I want to be able to creating things from scratch with D3.js, it requires time and practices and a never-give-up mindset.
- I split the learning progress into pieces during the weekend and holidays and didn’t push myself too hard to finish the course. It took me about two months to complete the journey.
- The video course lasts about 13 hours however it costs more than 20 hours in total if typing all code and digest the idea by yourself.